Setting Up Danube Go Client with Message Brokers on Kubernetes
This article may contain outdated information, for latest read Danube Documentation
In this article, I’ll guide you through the steps to use the Danube Go client library to interact with Danube PubSub messaging brokers running on a Kubernetes cluster hosted locally.
Here’s a diagram of the setup::
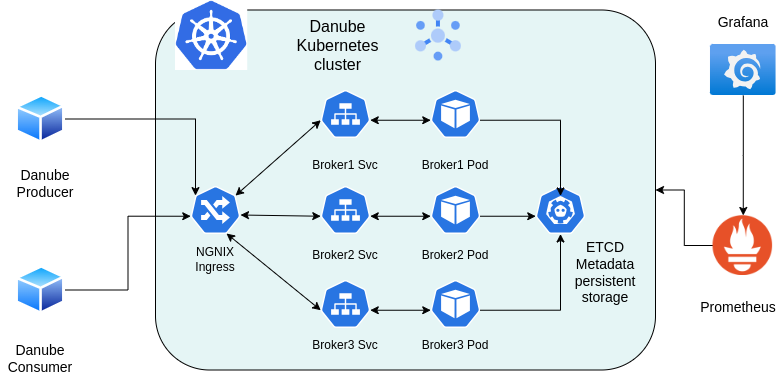
The setup includes:
- The Producer - We’ll run the script outlined in this post, which actually creates three producers (./pubsub-go-demo producer).
- The Consumer - Similarly, three distinct consumers are created (./pubsub-go-demo consumer).
- Danube Brokers - These are running on Kubernetes, with Nginx as the ingress controller and etcd for persistent metadata storage.
- Prometheus - It scrapes metrics from the Danube brokers, and Grafana is used to visualize them.
What is Danube
Danube is an open-source, distributed publish-subscribe (Pub/Sub) message broker system developed in Rust. For a detailed overview and its capabilities, you can explore the following resources:
Danube Go Client
For creating the Producers and Consumers, we’ll use the Danube Go Glient. The Go Client library for interacting with Danube Pub/Sub messaging platform.
Create the Danube Producers
I’ll cover only a portion of the code below. For the complete working code, please check this repository.
This Go program is designed to create HTTP endpoints that accept messages in different formats (JSON, string, and number) and send these messages to a PubSub system using the Danube Go client library. The messages are processed by producers, which are configured through a YAML file and interact with the Danube PubSub brokers.
The below configuration instruct the scirpt to create 3 producers, one that will send json, string and numbers as workloads.
producers:
  - name: producer_1
    topic: /default/topic_1
    schema: json
    json_schema: '{"type": "object", "properties": {"field1": {"type": "string"}, "field2": {"type": "integer"}}}'

  - name: producer_2
    topic: /default/topic_2
    schema: string

  - name: producer_3
    topic: /default/topic_3
    schema: number
ProducerConfig Struct:
This structure is used to parse the producer configuration from a YAML file. It defines the list of producers, each with a name, topic, schema type, and an optional JSON schema
type ProducerConfig struct {
 Producers []struct {
  Name       string `yaml:"name"`
  Topic      string `yaml:"topic"`
  Schema     string `yaml:"schema"`
  JsonSchema string `yaml:"json_schema,omitempty"` // Optional, but required if Schema is "json"
 } `yaml:"producers"`
}
startProducer function:
This function initializes the producers and starts an HTTP server to handle incoming messages. It reads the configuration, sets up producers, and registers HTTP handlers to specific endpoints:
- PUT /pubsub/json: Accepts JSON messages.
- PUT /pubsub/string: Accepts string messages.
- PUT /pubsub/number: Accepts number messages.
func startProducer(serverAddr *string, prodConfig *string, danubeAddr *string) {
 // Parse producer config
 var config ProducerConfig
 parseConfig(*prodConfig, &config)

 // Initialize producers based on config
 producers := initializeProducers(config, danubeAddr)

 // Start HTTP server
 mux := http.NewServeMux()
 mux.HandleFunc("PUT /pubsub/json", createJsonHandler(producers["json"]))
 mux.HandleFunc("PUT /pubsub/string", createStringHandler(producers["string"]))
 mux.HandleFunc("PUT /pubsub/number", createNumberHandler(producers["number"]))

 log.Printf("Starting producer HTTP server on %s", *serverAddr)
 log.Printf("Registered HTTP handlers:\n" +
  "  PUT /pubsub/json   -> Accept JSON format messages\n" +
  "  PUT /pubsub/string -> Accept string format messages\n" +
  "  PUT /pubsub/number -> Accept number format messages\n")

 log.Fatal(http.ListenAndServe(*serverAddr, mux))
}
initializeProducers function:
This function creates and initializes a set of producers based on the provided configuration. Each producer is associated with a specific schema type (e.g., JSON, string, or number). The Go Danube client is used to create these producers, which are then stored in a map for easy access by their schema type.
func initializeProducers(config ProducerConfig, danubeAddr *string) map[string]*danube.Producer {
 producers := make(map[string]*danube.Producer)
 client := danube.NewClient().ServiceURL(*danubeAddr).Build()

 for _, p := range config.Producers {
  ctx := context.Background()
  producerBuilder := client.NewProducer(ctx).
   WithName(p.Name).
   WithTopic(p.Topic)

  switch p.Schema {
  case "json":
   // Ensure the user has provided a jsonSchema
   if p.JsonSchema == "" {
    log.Fatalf("JSON schema is required for producer %s with schema type 'json'", p.Name)
   }
   producerBuilder.WithSchema("json_schema", danube.SchemaType_JSON, p.JsonSchema)

  case "string":
   producerBuilder.WithSchema("string_schema", danube.SchemaType_STRING, "")

  case "number":
   producerBuilder.WithSchema("number_schema", danube.SchemaType_INT64, "")

  default:
   log.Fatalf("Unknown schema type %s for producer %s", p.Schema, p.Name)
  }

  producer, err := producerBuilder.Build()
  if err != nil {
   log.Fatalf("Failed to initialize producer: %v", err)
  }

  if err := producer.Create(ctx); err != nil {
   log.Fatalf("Failed to create producer: %v", err)
  }

  producers[p.Schema] = producer
  log.Printf("Producer %s created for topic %s", p.Name, p.Topic)
 }

 return producers
}
The HTTP handlers are functions that process incoming HTTP requests. In this case, createJsonHandler processes requests for JSON messages.
- Content-Type Validation: It checks if the incoming request has a Content-Type header set to application/json. If not, it returns a 415 Unsupported Media Type error.
- Payload Reading: The function reads the payload (message body) from the request. If it’s empty or there’s an error, it returns a 400 Bad Request error.
- JSON Validation: The payload is then parsed as JSON to ensure it’s valid. If the JSON is malformed, it returns a 400 Bad Request error.
- Message Sending: If the payload is valid, it’s sent to the Danube broker using the configured producer. If successful, it logs the message ID and confirms the message was sent.
func createJsonHandler(producer *danube.Producer) http.HandlerFunc {
 return func(w http.ResponseWriter, r *http.Request) {

  if r.Header.Get("Content-Type") != "application/json" {
   http.Error(w, "Content-Type must be application/json", http.StatusUnsupportedMediaType)
   return
  }

  ctx := context.Background()

  payload, err := io.ReadAll(r.Body)
  if err != nil || len(payload) == 0 {
   http.Error(w, "Failed to read payload or payload is empty", http.StatusBadRequest)
   return
  }

  // Validate the JSON format
  var jsonData map[string]interface{}
  if err := json.Unmarshal(payload, &jsonData); err != nil {
   http.Error(w, "Invalid JSON format", http.StatusBadRequest)
   return
  }

  // Send the message using the producer
  messageID, err := producer.Send(ctx, payload, nil)
  if err != nil {
   http.Error(w, fmt.Sprintf("Failed to send message: %v", err), http.StatusInternalServerError)
   return
  }

  log.Printf("JSON Message sent with ID %v", messageID)
  fmt.Fprintln(w, "Message sent")
 }
}
The other handlers are similar, you can find all Here.
Create the Danube Consumers
Configuration: The YAML configuration file specifies the consumers, including their names, topics, subscription names, and subscription types.
consumers:
  - name: consumer_1
    topic: /default/topic_1
    subscription_name: subscription_1
    subscription_type: exclusive

  - name: consumer_2
    topic: /default/topic_2
    subscription_name: subscription_2
    subscription_type: shared

  - name: consumer_3
    topic: /default/topic_3
    subscription_name: subscription_3
    subscription_type: failover
Running the Consumer: When you run the startConsumer function, it initializes all the consumers as specified in the configuration file. Each consumer subscribes to its respective topic and begins listening for messages.
func startConsumer(consConfig *string, danubeAddr *string) {

 // Parse consumer config
 var config ConsumerConfig
 parseConfig(*consConfig, &config)

 // Start consumers based on config
 initializeConsumers(config, danubeAddr)
}
initializeConsumers Function:
This function creates and initializes consumers for each entry in the configuration file.
- A new Danube client is created and configured using the Danube service URL.
- For each consumer defined in the configuration, it creates a consumer with the specified name, topic, subscription name, and subscription type.
- The consumer is then subscribed to the topic, and if successful, it logs the creation.
- A goroutine is started to handle message consumption for each consumer.
func initializeConsumers(config ConsumerConfig, danubeAddr *string) {
 client := danube.NewClient().ServiceURL(*danubeAddr).Build()

 for _, c := range config.Consumers {
  ctx := context.Background()
  subType := getSubscriptionType(c.SubscriptionType)

  consumer, err := client.NewConsumer(ctx).
   WithConsumerName(c.Name).
   WithTopic(c.Topic).
   WithSubscription(c.SubscriptionName).
   WithSubscriptionType(subType).
   Build()
  if err != nil {
   log.Fatalf("Failed to initialize consumer: %v", err)
  }

  if err := consumer.Subscribe(ctx); err != nil {
   log.Fatalf("Failed to subscribe: %v", err)
  }

  log.Printf("Consumer %s created for topic %s", c.Name, c.Topic)

  // Start consuming messages
  go consumeMessages(consumer, c.Name)
 }

 // Block forever to keep consumers running
 select {}
}
consumeMessages function:
This function is responsible for receiving and processing messages for a specific consumer.
- It sets up a context and calls
Receiveon the consumer to start streaming messages. - It enters a loop where it continuously listens for incoming messages.
- For each received message, it logs the message payload.
func consumeMessages(consumer *danube.Consumer, consumerName string) {
 ctx := context.Background()
 stream, err := consumer.Receive(ctx)
 if err != nil {
  log.Fatalf("Failed to receive messages: %v", err)
 }

 for msg := range stream {
  log.Printf("Consumer %s received message: %s", consumerName, string(msg.GetPayload()))
 }
}
You can find the consumer Here.
Generate the messages
I’m using the hey to generate synthetic HTTP traffic the producer endpoints. The handlers would process each request, validate the message format, and then forward it to the appropriate PubSub topic.
 #!/bin/bash

# Loop until user cancels with Ctrl+C
while true
do
  # Invoke the string producer
  hey -n 10 -c 5 -m PUT -H "Content-Type: text/plain" -d "Hello, Danube!" http://localhost:4040/pubsub/string
  # Wait for 2 seconds
  sleep 2

  # Invoke the number producer
  hey -n 10 -c 5 -m PUT -H "Content-Type: text/plain" -d "3333" http://localhost:4040/pubsub/number
  # Wait for 2 seconds
  sleep 2

  # Invoke the json producer
  hey -n 10 -c 5 -m PUT -H "Content-Type: application/json" -d "{\"field1\": \"example_danube_json\", \"field2\": 123}" http://localhost:4040/pubsub/json
  # Wait for 2 seconds
  sleep 2
done
Create the infrastructure
To set up the environment described above, I’m following the guide: Run Danube on Kubernetes
Here’s a summary of the steps to create the infrastructure, though I recommend following the full instructions in the documentation:
- Create a Kubernetes Cluster: Set up a Kubernetes cluster on your local machine. I’m using kind for this purpose.
- Install Nginx Ingress Controller: This controller is essential for routing traffic to the Danube brokers based on the host. The Danube design requires clients to connect to different brokers within the cluster depending on the topic they are producing or consuming messages for.
- Install the Danube Messaging Platform: Use Helm to install the platform from the danube_helm repository. Make sure to configure the advertisedPort setting, which enables clients to reach the brokers through the ingress NodePort.
- Validate the Installation: Run
kubectl get allto ensure that all required services, pods, and the ingress controller are correctly set up, including Danube brokers, etcd for persistent metadata storage, and the Nginx ingress controller. - Configure Hostname Resolution: Ensure that the defined hostnames for the brokers resolve to the address used by the ingress NodePort. This step is crucial for proper routing within the cluster.
Run the scripts
Create the Producers
./pubsub-go-demo producer --prod-config example_configs/producer_config.yaml --danube-addr broker1.example.com:30115
2024/08/28 16:11:00 Starting Health Check Service for: 0 , with id: 2583889980657664623
2024/08/28 16:11:00 Producer producer_1 created for topic /default/topic_1
2024/08/28 16:11:03 Starting Health Check Service for: 0 , with id: 13381118769650629432
2024/08/28 16:11:03 Producer producer_2 created for topic /default/topic_2
2024/08/28 16:11:05 Starting Health Check Service for: 0 , with id: 7121082698479995011
2024/08/28 16:11:05 Producer producer_3 created for topic /default/topic_3
2024/08/28 16:11:05 Starting producer HTTP server on 0.0.0.0:4040
2024/08/28 16:11:05 Registered HTTP handlers:
  PUT /pubsub/json   -> Accept JSON format messages
  PUT /pubsub/string -> Accept string format messages
  PUT /pubsub/number -> Accept number format messages
Create the Consumers
./pubsub-go-demo consumer --cons-config example_configs/consumer_config.yaml --danube-addr broker1.example.com:30115
2024/08/28 16:13:54 Starting Health Check Service for: 1 , with id: 17048471677142325643
2024/08/28 16:13:54 Consumer consumer_1 created for topic /default/topic_1
2024/08/28 16:13:54 Starting Health Check Service for: 1 , with id: 18139169689358065315
2024/08/28 16:13:54 Consumer consumer_2 created for topic /default/topic_2
2024/08/28 16:13:54 Starting Health Check Service for: 1 , with id: 10064914759562654799
2024/08/28 16:13:54 Consumer consumer_3 created for topic /default/topic_3
Generate the synthetic traffic
Use the bash script that can be found Here to generate traffic to all exposed producer HTTP endpoints.
./script/loop_requests.sh
Prometheus and Grafana for monitoring
The Danube brokers expose port 9040 for Prometheus metrics, though this can be configured to use other ports if needed. When running in Kubernetes, additional routes must be added to the ingress, which can be managed in future updates of the danube_helm charts.
For simplicity, I will use port forwarding to access the Prometheus metrics port of the brokers directly:
kubectl port-forward svc/my-danube-cluster-danube-broker1 9043:9040 &
kubectl port-forward svc/my-danube-cluster-danube-broker2 9044:9040 &
kubectl port-forward svc/my-danube-cluster-danube-broker3 9045:9040 &
[6] 341799
[7] 341807
[8] 341815
Forwarding from 127.0.0.1:9043 -> 9040
Forwarding from [::1]:9043 -> 9040
Forwarding from 127.0.0.1:9044 -> 9040
Forwarding from [::1]:9044 -> 9040
Forwarding from 127.0.0.1:9045 -> 9040
Forwarding from [::1]:9045 -> 9040
In order to test that it works, you can access the endpoints:
curl http://0.0.0.0:9043
# HELP danube_topic_msg_in_counter Total messages published to the topic (msg).
# TYPE danube_topic_msg_in_counter counter
danube_topic_msg_in_counter{topic="/default/topic_3",producer="7121082698479995011"} 1460
danube_topic_msg_in_counter 0

# HELP danube_consumer_msg_out_counter Total messages delivered to consumer (msg).
# TYPE danube_consumer_msg_out_counter counter
danube_consumer_msg_out_counter{topic="/default/topic_3",consumer="554941362118759728"} 91
danube_consumer_msg_out_counter 0
danube_consumer_msg_out_counter{topic="/default/topic_3",consumer="10064914759562654799"} 1340

# HELP danube_topic_bytes_in_counter Total bytes published to the topic (bytes)
# TYPE danube_topic_bytes_in_counter counter
danube_topic_bytes_in_counter{topic="/default/topic_3",producer="7121082698479995011"} 5840
danube_topic_bytes_in_counter 0
I configured Prometheus with the following scrape configuration for the Danube exporters:
  # Scrape configuration for Danube exporter
  - job_name: 'danube_exporter'
    static_configs:
      - targets: ['127.0.0.1:9043']
      - targets: ['127.0.0.1:9044']
      - targets: ['127.0.0.1:9045']
To start Prometheus (running locally in this example), use the following command:
./prometheus --config.file=./prometheus.yml
Once Prometheus is running, you can access the web interface at: http://localhost:9090
Grafana is installed locally as well, with this guide.
To start Grafana on the localhost, use the following command:
sudo /bin/systemctl start grafana-server
Now you should be able to visualize the DAnube Metrics in Grafana:
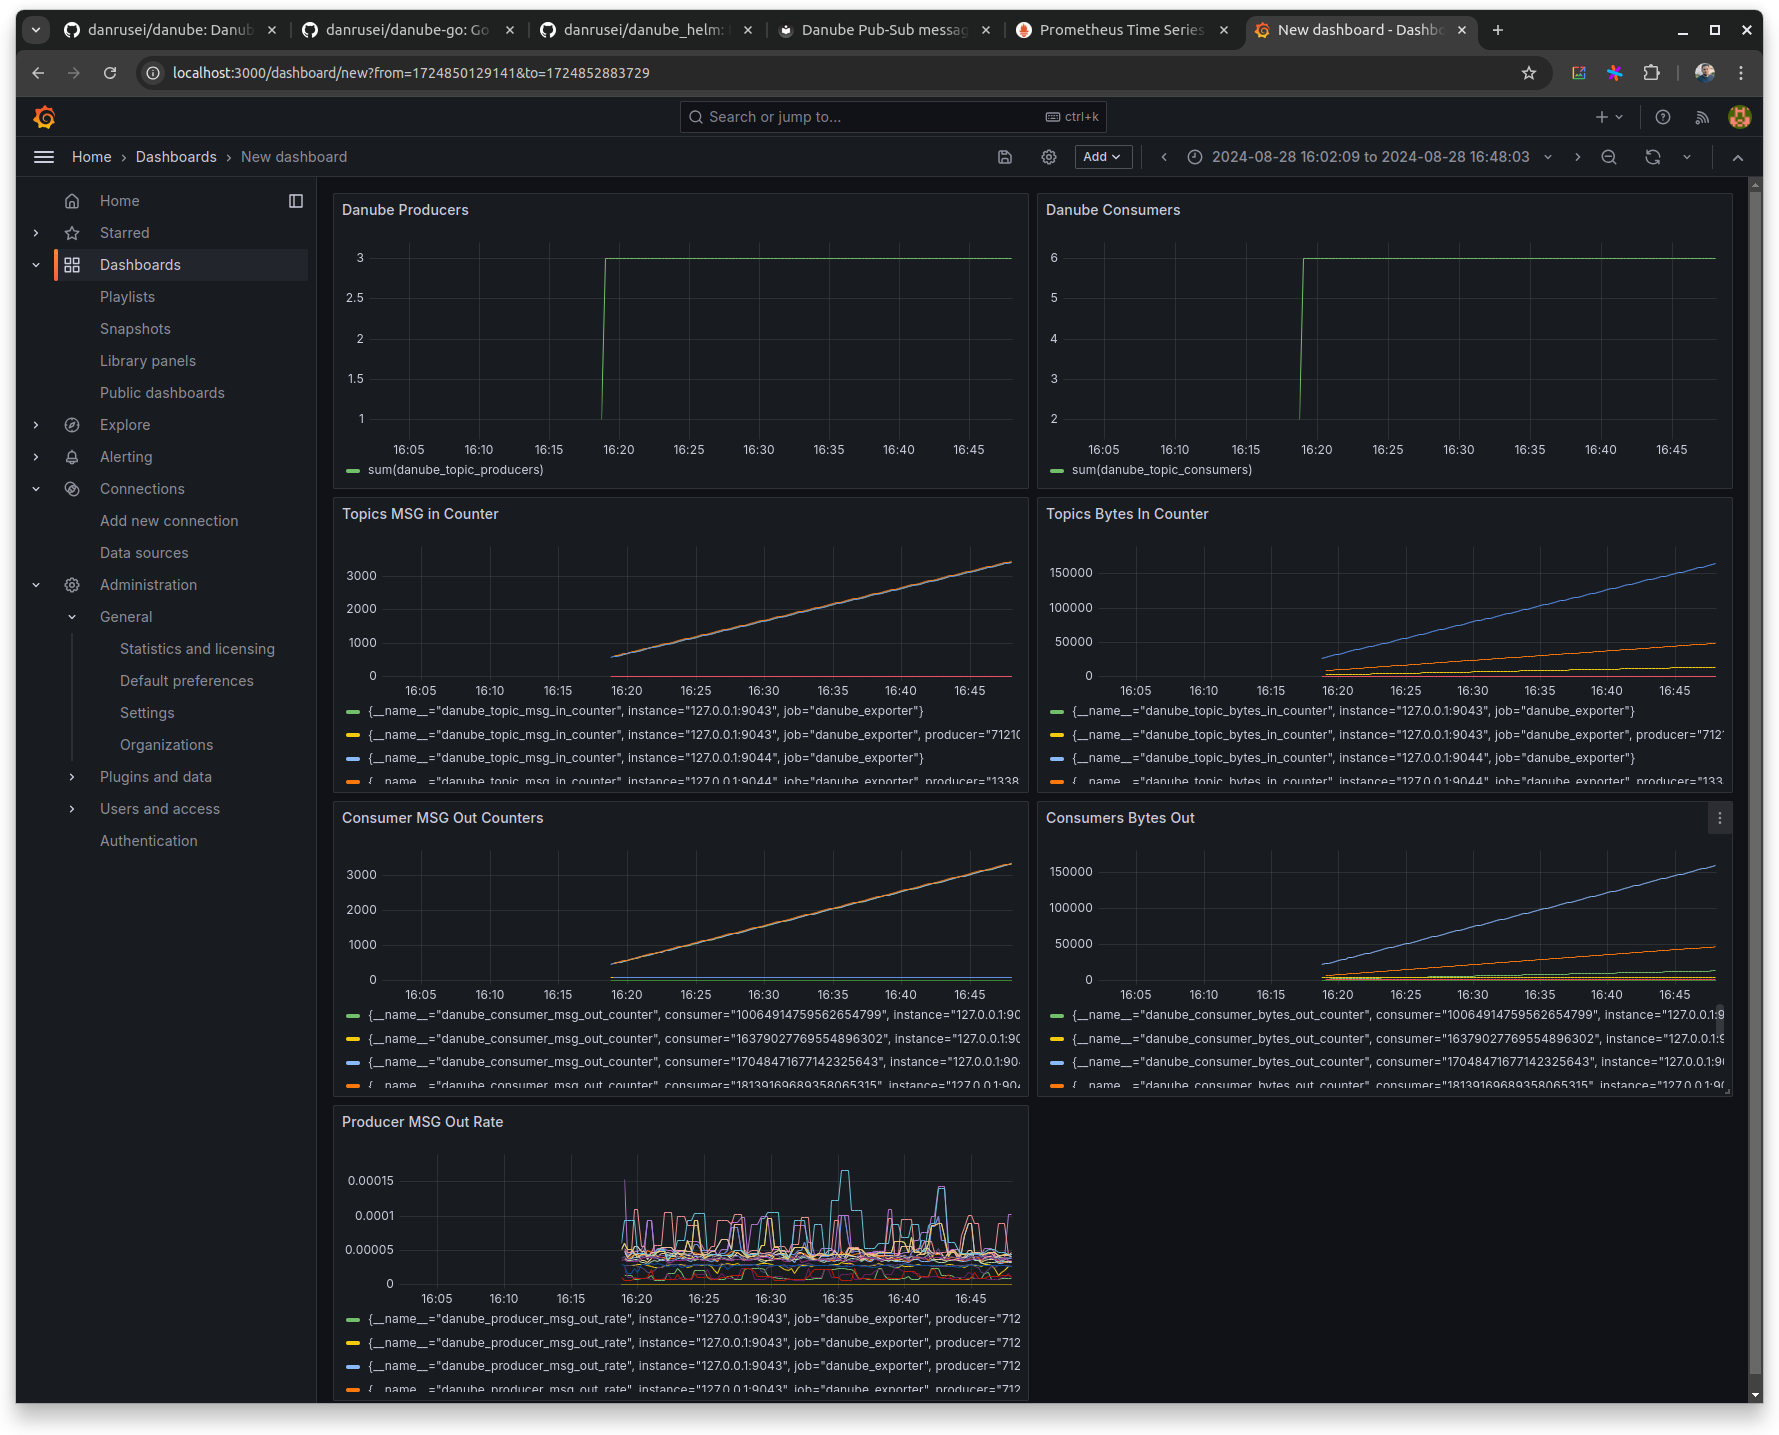
Conclusion
In this guide, we’ve walked through setting up a performant messaging system using the Danube PubSub platform on a Kubernetes cluster. We covered configuring both producers and consumers in Go, setting up the necessary infrastructure with Kubernetes and Helm, and integrating monitoring with Prometheus and Grafana. The steps outlined here should give you a foundation to start working with Danube in a local Kubernetes environment, allowing you to experiment with message production, consumption, and monitoring.
If you found this guide helpful, consider giving a star to the Danube messaging repository or the Danube Go client on GitHub. Your support helps the project grow and reach more users.
If you have feature requests or encounter issues, please don’t hesitate to open an issue on GitHub. I welcome all feedback and contributions, and if you’re interested in becoming a contributor, don’t hesitate to work on improving and expanding the capabilities of Danube.