Part 1: Diagnose Go code - beginner guide
In this blog post I’ll iterate over a simple script and refactor it each time to improve its performance. Before diving into the details I would quote a couple of well known individuals from the GO Community.
“You want to write code that is optimized for correctness. Don’t make coding decisions based on what you think might perform better. You must benchmark or profile to know if code is not fast enough. Then and only then should you optimize for performance. This can’t be done until you have something working.” ~ Bill Kennedy
“Start with the simplest possible code.
Measure. Profile your code to identify the bottlenecks, do not guess.
If performance is good, stop. You don’t need to optimise everything, only the hottest parts of your code.
Don’t trade performance for reliability.” ~ Dave Cheney
Our goal is to parse a 692M txt file, that has over 1.7 million lines and extract some data. The head of the file looks like this:
$ head -2 test.txt
3162355547410993243#{"continent": "Europe", "subContinent": "Western Europe", "country": "Germany", "region": "not available in demo dataset", "metro": "not available in demo dataset", "city": "not available in demo dataset", "cityId": "not available in demo dataset", "networkDomain": "(not set)", "latitude": "not available in demo dataset", "longitude": "not available in demo dataset", "networkLocation": "not available in demo dataset"}
8934116514970143966#{"continent": "Americas", "subContinent": "Northern America", "country": "United States", "region": "California", "metro": "San Francisco-Oakland-San Jose CA", "city": "Cupertino", "cityId": "not available in demo dataset", "networkDomain": "(not set)", "latitude": "not available in demo dataset", "longitude": "not available in demo dataset", "networkLocation": "not available in demo dataset"}
As you can see there is a number at the beginning of each line separated by “#” from the json content. Once the file is parsed we want the script to:
- Count the number of valid Luhn numbers (check each number if it is a valid Luhn)
- Find the country with the highest number of hits (parse the json, hits means the number of times the users from a specific country accessed the site)
- Find the continent with the highest number of unique countries that accessed the site more than 1000 times. (parse the json)
Once the script is executed we will get this:
There are 169257, out of 1708337, valid Luhn numbers.
United States has the biggest # of visitors, with 717217 of hits.
Europe is the continent with most unique countries that accessed the site more than 1000 times. It has 33 unique countries.
If you wonder how I got this file, it’s from the Google Analytics Customer Revenue Prediction - Kaggle Competition. In this competition, data scientists are challenged to analyze a Google Merchandise Store customer dataset to predict revenue per customer.
This is not what we are doing here! We just use some subset of this data to respond to the above questions. I downloaded the 24G train_v2.csv file, and parsed using the script that can be found in the extract folder. Make sure you create the csv_files directory at the root of the folder and copy the file. Running the script, output a smaller txt file of 692M size.
Iter 1 - The starting code
We got the file and the request is clear. First objective is to create a script as simple as possible to output the results. The result struct is gathering all the info that will be printed out at the end of the program. The file, with over 1.7 Milions of lines, is opened and a pointer to the file is sent over as argument to getStatistics method. getStatistics is a method of the result struct and it contains all the business logic.
type result struct {
	validLuhn         int      //the number of valid Luhn numbers
	nrLines           int      //number the lines from the file
	country           string   //the country with the highest number of hits
	hitsPerCountry    int      //the number hits of this country
	continent         string   //the continent with higher number of unique countries that accessed the site more than 1000 times
	countriesWithHits int      //how many countries, part of the above continent have over 1000 hits
}

file, err := os.Open("../csv_files/test.txt")
if err != nil {
	log.Fatal(err)
}
defer file.Close()

results := result{}
results.getStatistics(file)

fmt.Printf("There are %d, out of %d, valid Luhn numbers. \n", results.validLuhn, results.nrLines)
fmt.Printf("%s has the biggest # of visitors, with %d of hits. \n", results.country, results.hitsPerCountry)
fmt.Printf("%s is the continent with most unique countries that accessed the site more than 1000 times. It has %d unique countries. \n", results.continent, results.countriesWithHits)
The getStatistics function loops over all the lines of the document, split each line after “#” and grab the number from the beginning of the line and the json struct. Each number is checked if it’s a valid Luhn, using luhn.Valid() function, if true the validLuhn variable from the struct is increased. We can ignore the Luhn code for the moment, I’ll get back to it in the last iteration, when I’ll try to improve the algorithm.
The Json struct is unmarshaled into the region struct, and takes only the data of interest. Lastly the countries are mapped to continents using a map structure: continents[reg.Country] = reg.Continent. The number of hits per country are gathered: countries[reg.Country]++.bufio.NewScanner() is used to read line by line, it accepts an io.Reader as argument and returns a new Scanner. os.File is an io.Reader. The scanner.Scan() has the following signature:
func (s *Scanner) Scan() bool
It advances the Scanner to the next token, which will then be available through the Bytes or Text method. It returns false when the scan stops, either by reaching the end of the input or an error. scan.Text() returns the most recent token generated by a call to Scan as a newly allocated string holding its bytes. It returns the line as a string.
func (r *result) getStatistics(stream io.Reader) {
//region struct is used to Unmarshal the JSON
type region struct {
Continent string `json:"continent"`
Country string `json:"country"`
}
countries := map[string]int{}
continents := map[string]string{}
scanner := bufio.NewScanner(stream)
for scanner.Scan() {
r.nrLines++
text := scanner.Text()
split := strings.Split(text, "#")
if len(split) < 2 {
continue
}
number := strings.TrimSpace(split[0])
description := strings.TrimSpace(split[1])
if luhn.Valid(number) {
r.validLuhn++
}
var reg region
err := json.Unmarshal([]byte(description), ®)
if err != nil {
log.Println(err)
}
countries[reg.Country]++
if _, ok := continents[reg.Country]; !ok {
continents[reg.Country] = reg.Continent
}
}
.....
}
In the last part, we iterate over the slices and the maps to collect the required information that will be addedto the result struct.
	for k, v := range countries {
		if v > r.hitsPerCountry {
			r.hitsPerCountry = v
			r.country = k
		}
	}

	regions := map[string]int{}
	for k, v := range continents {
		if countries[k] > 1000 {
			regions[v]++
		}
	}

	r.countriesWithHits = 1
	for k, v := range regions {
		if v > r.countriesWithHits {
			r.continent = k
			r.countriesWithHits = v
		}
	}
Except the Luhn algorithm, that will be reviewed in the last iteration, this is the entire code. The code is available on github, so you can download it and try it out.
Find below the results I’m getting while running the code. It took ~ 8.713s to complete. Based on the usecase, the time can be acceptable or not. If it’s a one time shot script or it brings less to none business value, then don’t think it’s worth it to spend too much time on improving it. In this case, let’s assume that it is part of a critical business process, so any improvements are beneficial.
$ time ./iter_1_startscript
There are 169257, out of 1708337, valid Luhn numbers.
United States has the biggest # of visitors, with 717217 of hits.
Europe is the continent with most unique countries that accessed the site more than 1000 times. It has 33 unique countries.

real	0m8,713s
user	0m9,213s
sys	    0m0,319s
Diagnose Go Code
The Go ecosystem provides a large suite of APIs and tools to diagnose logic and performance problems in Go programs. It’s out of the scope of this article to cover all the posible technics, I’ll show how to profle an application and how to analyze latency using the tracing tool.
Diagnostics solutions::
- Profiling: Profiling tools analyze the complexity and costs of a Go program such as its memory usage and frequently called functions to identify the expensive sections of a Go program.
- Tracing: Tracing is a way to instrument code to analyze latency throughout the lifecycle of a call or user request. Traces provide an overview of how much latency each component contributes to the overall latency in a system.
- Debugging: Debugging allows us to pause a Go program and examine its execution. Program state and flow can be verified with debugging.
- Runtime statistics and events: Collection and analysis of runtime stats and events provides a high-level overview of the health of Go programs.
Types of Profilers:
- CPU Profiler: shows what functions consume what percent of CPU time. When enabled the runtime will interrupt itself every 10ms and record the stack trace of the currently running goroutines.
- Memory Profiler: shows what functions allocate heap memory. You can visualize only allocations live at the time of profile collection (
--inuse_spaceflag to pprof, default), or all allocations happened since program start (--alloc_spaceflag to pprof). By default memory profiling samples 1 in every 1000 allocations. - Blocking Profiler: shows where goroutine block waiting on synchronization primitives.This can be useful for determining concurrency bottlenecks in the application.
- Goroutine Profiler: gives you the current stacks of all live goroutines in the process. It can be handy to debug load balancing issues, or to debug deadlocks.
I’ll use extensively profiling and tracing for this code to discover the bottlenecks and the oportunitines to improve the code.
Benchmarking the code
There are three ways to get access to the profile:
- using the Benchmarks like “go test -bench=FunctionToBench” with
-cpuprofile,-memprofileor-blockprofileflags. - using net/http/pprof library. This is the ideal solution for network servers.
- doing manual profile collection, by importing runtime/pprof in the main program and adding a few lines of code to start/stop profile.
As my program is not running any http server an elegant solution is to use the benchmarks to profile the code. The testing package has built in support for writing benchmarks. Benchmarks are similar to tests, the only real difference is it takes a *testing.B rather than a *testing.T and the benchmark function lives alongside your tests in the _text.go file. b.N is the number of iterations the benchmark should run for. b.N starts at 1, if the benchmark function completes in under 1 second then b.N is increased and the benchmark function runs again.
func BenchmarkGetStatistics(b *testing.B) {

	file, err := os.Open("../csv_files/test.txt")
	if err != nil {
		log.Fatal(err)
	}
	defer file.Close()

	b.ResetTimer()
	results := result{}

	for i := 0; i < b.N; i++ {
		results.getStatistics(file)
	}
}
Performance measurement
In this case the benchmark will run only once (at least for the first number of iterations), as the time to run the function is over 9s. The workarounds could be to reduce the size of the parsed file or to increase the -benchtime flag, which force to run the same benchmark until it reached a value of b.N. If you want to increase the benchmark accuracy, you should consider these aspects, in this case it gives me valuable information using the defaults. -benchmem flag instructs the testing framework to report allocation statistics.
You can use either the go tool pprof to open the profile file or install pprof as a standalone program. I have not observed any differences in using one vs the other.
As shown below, it takes a long time to complete the function and also there are alot of allocations to the Heap.
$ go test -bench GetStatistics -cpuprofile cpu.pprof
goos: linux
goarch: amd64
pkg: github.com/danrusei/dev-state_blog_code/tree/master/diagnose_go_code/iter_1_startscript
BenchmarkGetStatistics-8   	       1	9367019288 ns/op
PASS
ok  	github.com/danrusei/dev-state_blog_code/tree/master/diagnose_go_code/iter_1_startscript	9.538s

########

$ go test -bench GetStatistics -memprofile mem.pprof -benchmem
goos: linux
goarch: amd64
pkg: github.com/danrusei/dev-state_blog_code/tree/master/diagnose_go_code/iter_1_startscript
BenchmarkGetStatistics-8   	       1	9068461723 ns/op	2817476848 B/op	25624358 allocs/op
PASS
ok  	github.com/danrusei/dev-state_blog_code/tree/master/diagnose_go_code/iter_1_startscript	9.072s
Both mem.pprof and cpu.pprof are saved in the same folder with the main and _test file. To open the files you have the cli option using “got tool pprof cpu.pprof” or visualize in a browser, which is nicer as it helps you to easily spot the large memory and cpu consumers.
//Using the build in http server
pprof -http=localhost:8081 cpu.pprof
or
go tool pprof -http=localhost:8081 cpu.pprof
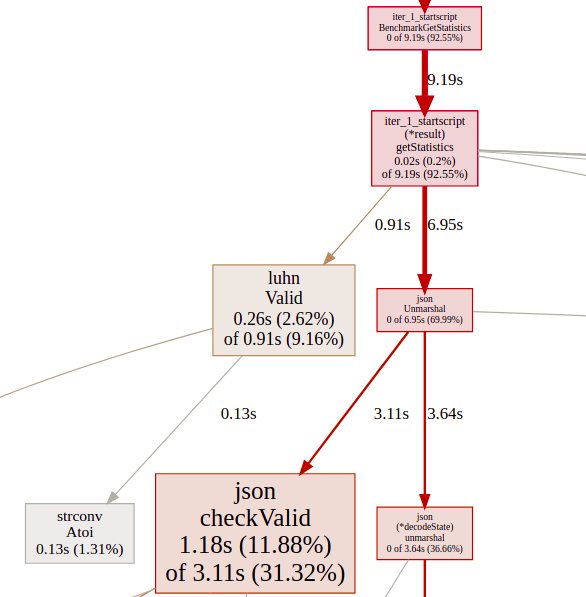
The graph is bigger, I cropped the part of interest. From the total amount of 9.19 seconds, json.Unmarshal consumes 6.95 seconds and luhn.Valid() 0.91 seconds.
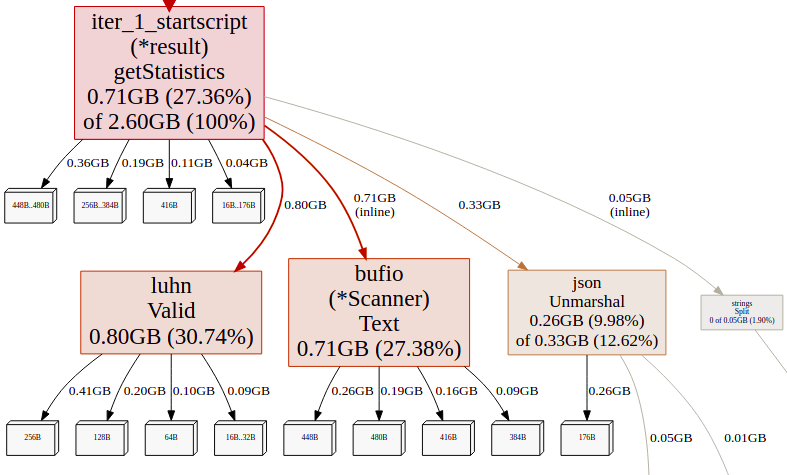
Opening the mem.pprof as well, there are alot of allocations and the big consumers are again luhn.Valid() , scanner.Text(), json.Unmarshal. Stack allocations are assumed to be free and are not_tracked in the memory profile.
Iter 2 - Adding Concurrency (Goroutines)
The current program is single threaded, therefore it uses one CPU throughout the entire program. But this is GO Language and spinning up goroutines it’s cheap. Concurrency is in everyone’s mind and this is one thing that everyone knows that Go is doing very well. So let’s give it a try and see if that makes any difference.
I created the worker pattern, it spun up a number of goroutines in a for loop (the routines is an argument to the function). The basic synchronization primitives are used for mutual exclusion locks and goroutines synchronization. The Mutex locks the access of a goroutine to a variable at a time to avoid data racing. If the lock is already in use, the calling goroutine blocks until the mutex is available.
A WaitGroup waits for a collection of goroutines to finish. The main goroutine calls wg.Add() to set the number of goroutines to wait for. Then each of the goroutines runs and calls wg.Done() when finished. At the same time, wg.Wait() is used to block until all goroutines have finished.
The flow of the program has changed, the goroutines are feeded by the lines channel. lines is a buffered channel that accepts a string from scanner.Text(). Being buffered should reduce the contention as the main goroutine will fill it up while the other goroutines consume the strings from the channel. The for statement “for text := range lines” loops until the channel is closed, so the main goroutine has no more lines to send it over.
routines := runtime.NumCPU() * 2
....
func (r *result) getStatistics(stream io.Reader, routines int) {
//region struct is used to Unmarshal the JSON
type region struct {
Continent string `json:"continent"`
Country string `json:"country"`
}
countries := map[string]int{}
continents := map[string]string{}
mutex := sync.Mutex{}
wg := sync.WaitGroup{}
lines := make(chan string, routines)
for i := 0; i < routines; i++ {
wg.Add(1)
go func() {
defer wg.Done()
for text := range lines {
split := strings.Split(text, "#")
if len(split) < 2 {
continue
}
number := strings.TrimSpace(split[0])
description := strings.TrimSpace(split[1])
if luhn.Valid(number) {
mutex.Lock()
r.validLuhn++
mutex.Unlock()
}
var reg region
err := json.Unmarshal([]byte(description), ®)
if err != nil {
log.Println(err)
}
mutex.Lock()
countries[reg.Country]++
if _, ok := continents[reg.Country]; !ok {
continents[reg.Country] = reg.Continent
}
mutex.Unlock()
}
}()
}
scanner := bufio.NewScanner(stream)
for scanner.Scan() {
r.nrLines++
lines <- scanner.Text()
}
close(lines)
wg.Wait()
.......
}
The program is much faster right now. The time has reduced from ~ 9 sec to 2.261 sec, which is a significant improvement. It is worth to notice that the user time is 15 sec, this indicates that the program is using multiple CPU cores.
Is it fast enough ? We don’t know, let’s see what are the measurements showing to us.
$ time ./iter_2_goroutines
There are 169257, out of 1708337, valid Luhn numbers.
United States has the biggest # of visitors, with 717217 of hits.
Europe is the continent with most unique countries that accessed the site more than 1000 times. It has 33 unique countries.

real	0m2,261s
user	0m15,618s
sys	    0m0,365s
Performance measurement
The CPU time has significantly decrease as we can see also from “ns/op”, the allocations hasn’t changed, but the program is faster.
$ go test -bench GetStatistics -cpuprofile cpu.pprof
goos: linux
goarch: amd64
pkg: github.com/danrusei/dev-state_blog_code/tree/master/diagnose_go_code/iter_2_goroutines
BenchmarkGetStatistics-8   	       1	2465210319 ns/op
PASS
ok  	github.com/danrusei/dev-state_blog_code/tree/master/diagnose_go_code/iter_2_goroutines	2.615s

########

$ go test -bench GetStatistics -memprofile mem.pprof -benchmem
goos: linux
goarch: amd64
pkg: github.com/danrusei/dev-state_blog_code/tree/master/diagnose_go_code/iter_2_goroutines
BenchmarkGetStatistics-8   	       1	2257857809 ns/op	2817558408 B/op	25624869 allocs/op
PASS
ok  	github.com/danrusei/dev-state_blog_code/tree/master/diagnose_go_code/iter_2_goroutines	2.262s
The profile still gives us a lot of valuable information, but there is another tool that can offer us a different perspective, that’s the trace. Traces provide an overview of how much latency each component contributes to the overall latency in a system. The trace profile offers timing resolution down to the microsecond level that can’t be achieved with external profiling.
Tracing
To enable the tracing you have to import “runtime/trace” in your main program and add following code lines in the main function. It creates the trace file and will impact a litle bit the performance, but it doesn’t matter as this will be disabled once it’s not needed.
tracefile, err := os.OpenFile("m.trace", os.O_APPEND|os.O_CREATE|os.O_WRONLY, 0600)
if err != nil {
	log.Fatal(err)
}
defer tracefile.Close()

trace.Start(tracefile)
defer trace.Stop()
Use go tool trace to open the trace file. This time, in this iteration the trace file is big ~74 MB, as there are many goroutines runnning. It will be smaller in the next iterations, ~ 5 MB. Therefore, it will take awhile to open. The trace will be splitted on multiple traces.
$ go tool trace m.trace
In the main menu there are number of items:
- View Trace - The most complex, powerful and interactive visualization shows a timeline of the entire program execution. This view displays, for example, what was running on each of the virtual processors and what was blocked waiting to run.
- Goroutine analysis - Shows how many of each kind of goroutines were created during the entire execution. You can see how long each goroutine was blocked while trying to acquire a lock on a mutex, reading from the network, running.
- Network/Sync/Syscall blocking profile - These contain graphs that displays how long goroutines spent blocked on each of these resources. They are pretty close to the ones available on memory/cpu profiler on pprof.
- Scheduler latency profiler - Provides timing for scheduler level information showing where time is most spent scheduling.
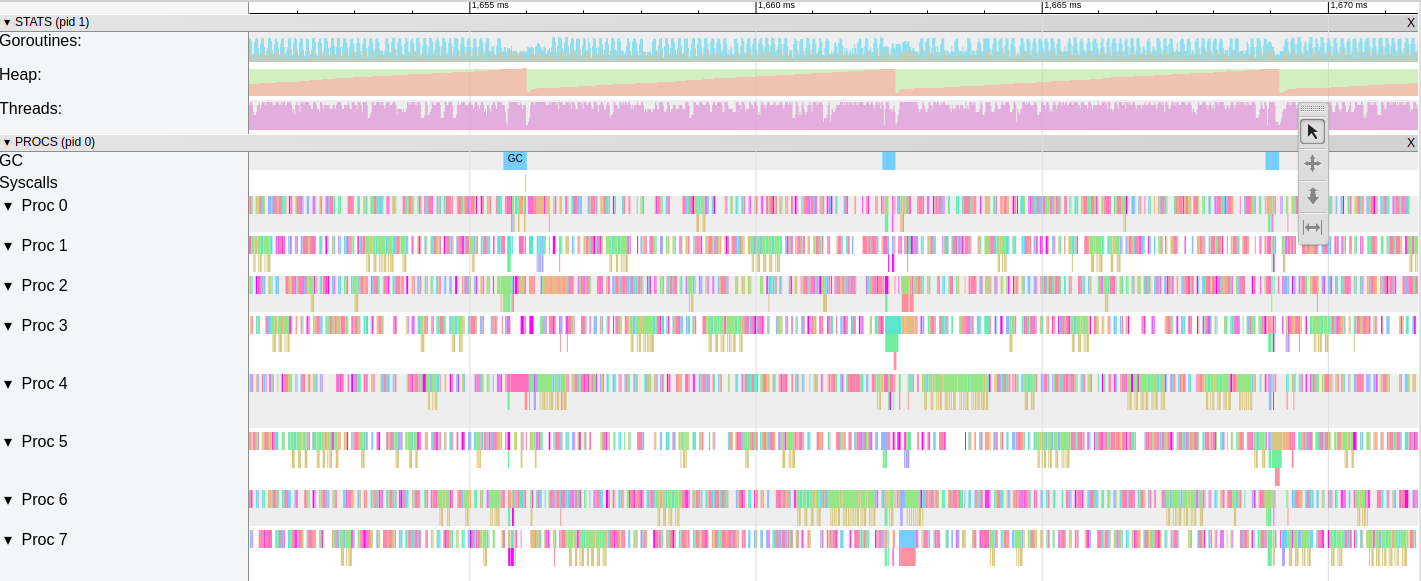
Once you select the View Trace it will open a new window. Check out below the trace of this iteration.
- Timeline - shows the time during the execution
- Heap - shows memory allocations during the execution, this can be really useful to find memory leaks and to check how much memory the garbage collection is being able to free at each run
- Goroutines - shows how many goroutines are running and how many are runnable (waiting to be scheduled) at each point in time.
- OS Threads - shows how many OS threads are being used and how many are blocked by syscalls
- GC - shows how frequent the Garbage Colector is running
- Procs - shows a line for each virtual processor.
W , S, A, D keyboard keys can be used to navigate through the file.
This iteration trace shows us that the preasure on heap is big. The Garbage Colector has to run every ~ 10 ms and if you zoom in you’ll observe that most of the time the processors are idle. Looks a the gaps (white spaces) between the goroutines, each color is a goroutine.
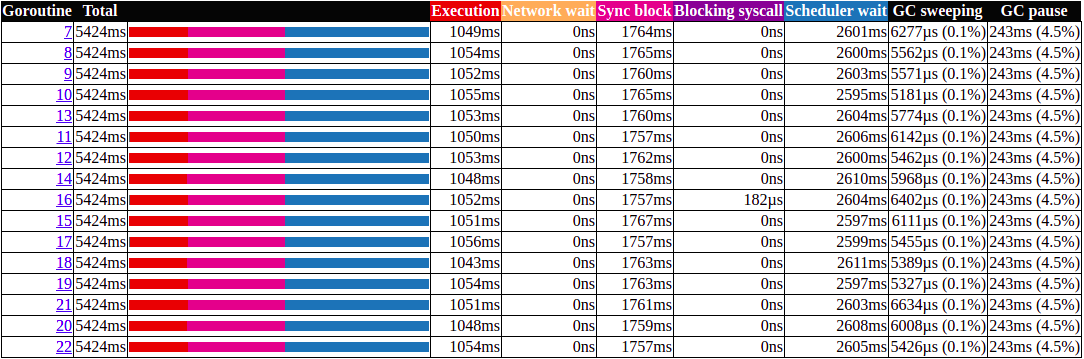
For a better big picture, check out bellow the Goroutine analysis, it show us that the goroutines are running less than 1/3 of the time. They are waiting to be scheduled or they are blocked by the Sync lock. This is lock contentions, when too many goroutines are competing to obtain a lock on a resource.
We can’t leave it like this, even if it’s faster compared with the previous iteration, we still have to reduce contention and make it run more efficiently. In the next blog post I’ll go through another 3 iterations to improve code performance.