Part 2: Diagnose Go code - beginner guide
This is the continuation of the previous post. I would strongly recommend reading Part 1 first then continue here as the description of the program, the intent and the current state are relevant as we move forward.
Iter 3 - Remove Contention
Reading line by line from the stream and sending those over to the goroutines to be processed works, but may not be the most efficient way to process a large file. Instead we could batch a number of lines, defined by the CacheSize constant, within a channel. That will become a pointer to a slice of strings chan *[CacheSize]string instead of chan string.
Also creating every time a new slice of strings is putting a lot of pressure on the garbage collector. Standard library contains the sync.Pool type that allows to reuse the same object several times in between garbage collections. A Pool is safe for use by multiple goroutines simultaneously. It makes it easy to build efficient, thread-safe free lists and reuse transient objects to reduce number of allocations.
This is the Pool Struct, which has the New field that is a func() interface{}.
type Pool struct {
    New func() interface{}
}
Get method linesPool.Get() selects an arbitrary item from the Pool, removes it from the Pool, and returns it to the caller. Put method linesPool.put() adds the tem to the pool.
Below we allocate a *[CacheSize]string and send over the channel once the number of lines is equal to Cachesize.
const CacheSize = 64 * 1024

linesPool := sync.Pool{
	New: func() interface{} {
		return new([CacheSize]string)
	},
}

lines := make(chan *[CacheSize]string, routines)

.............

scanner := bufio.NewScanner(stream)
iter := 0
pool := linesPool.Get().(*[CacheSize]string)

for {
	valid := scanner.Scan()
	if iter == CacheSize || !valid {
		lines <- pool
		iter = 0
		pool = linesPool.Get().(*[CacheSize]string)

	}
	if !valid {
		break
	}
	r.nrLines++
	pool[iter] = scanner.Text()
	iter++
}
Within the goroutines we get the batch from the channel, the take line by line and parse the data. Before exiting the goroutine we put the item back in the Pool.
for cache := range lines {

	for _, text := range cache {
     ........
    }
    linesPool.Put(cache)
}
Comparing the time with previous iteration, it is not a major gain, we just shaved ~ 100ms, or maybe less.
$ time ./iter_3_contention
There are 169257, out of 1708337, valid Luhn numbers.
United States has the biggest # of visitors, with 717217 of hits.
Europe is the continent with most unique countries that accessed the site more than 1000 times. It has 33 unique countries.

real	0m2,153s
user	0m14,152s
sys	    0m0,670s
Performance measurement
Again, sending over the batches of lines doesn’t seem to make a big difference, at the first sight, as there are still other large consumers in the program. But it will help a lot once the bottlenecks are removed. Using sync.Pool is a recommended pattern for transient objects.
$ go test -bench GetStatistics -cpuprofile cpu.pprof
goos: linux
goarch: amd64
pkg: github.com/danrusei/dev-state_blog_code/tree/master/diagnose_go_code/iter_3_contention
BenchmarkGetStatistics-8   	       1	2125320341 ns/op
PASS
ok  	github.com/danrusei/dev-state_blog_code/tree/master/diagnose_go_code/iter_3_contention	2.452s

########

$ go test -bench GetStatistics -memprofile mem.pprof -benchmem
goos: linux
goarch: amd64
pkg: github.com/danrusei/dev-state_blog_code/tree/master/diagnose_go_code/iter_3_contention
BenchmarkGetStatistics-8   	       1	2106188910 ns/op	2845736048 B/op	25685616 allocs/op
PASS
ok  	github.com/danrusei/dev-state_blog_code/tree/master/diagnose_go_code/iter_3_contention	2.255s
Let’s examine the trace again. If we compare with the trace from the previous iteration:
- the Threads are busy most of the time
- the Heap is growing slower, therefore the Garbage Collector runs less frequent (every
250 mscompared with8 msin iter2) - the Goroutines are using the procesors more efficient, there are no gaps
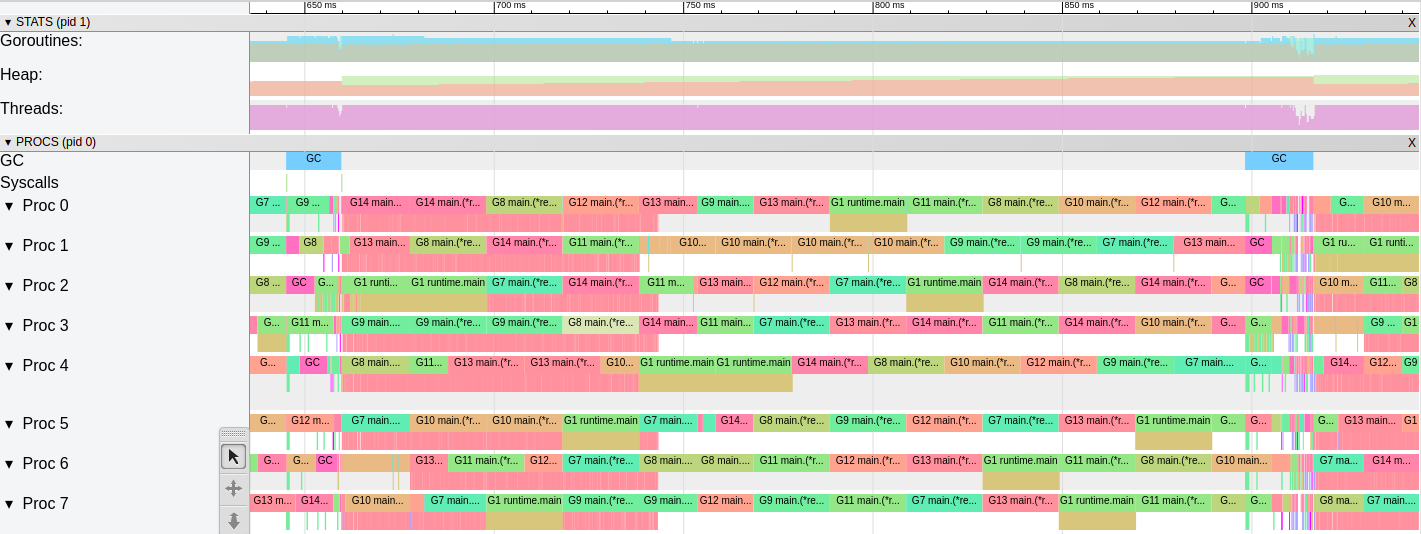
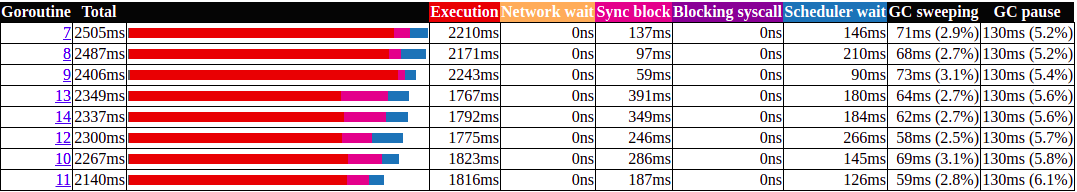
On the Goroutines analysis the difference is also consistent, now the Goroutines are spending most of the time in Execution, which is preferable.
Iter 4 - Remove Json Marshaling
Based on the early observations we know that json.Unmarshal is the biggest processor consumer. Maybe in some applications we should live with that, fortunate in our case we can get rid of it and use instead the strings.SplitN function, as the string pattern is constant.
dep := strings.SplitN(description, "\"", 13)
continent = dep[3]
country = dep[11]
Running the script again, it just leaves us with a smiley face. That’s a difference, down to 0,829s from 2,153s . It was an easy one, that’s why you should look first for the low hanging fruits.
$ time ./iter_4_removejson
There are 169257, out of 1708337, valid Luhn numbers.
United States has the biggest # of visitors, with 717217 of hits.
Europe is the continent with most unique countries that accessed the site more than 1000 times. It has 33 unique countries.

real	0m0,829s
user	0m3,868s
sys	    0m0,381s
Performance measurement
The number of allocations per operation decreased significatly and as you may observe the Benchmark is running 64 times now, because the program is faster.
$ go test -bench GetStatistics -cpuprofile cpu.pprof
goos: linux
goarch: amd64
pkg: github.com/danrusei/dev-state_blog_code/tree/master/diagnose_go_code/iter_4_removejson
BenchmarkGetStatistics-8   	      64	  16201405 ns/op
PASS
ok  	github.com/danrusei/dev-state_blog_code/tree/master/diagnose_go_code/iter_4_removejson	11.731s

########

$ go test -bench GetStatistics -memprofile mem.pprof -benchmem
goos: linux
goarch: amd64
pkg: github.com/danrusei/dev-state_blog_code/tree/master/diagnose_go_code/iter_4_removejson
BenchmarkGetStatistics-8   	      84	  12098290 ns/op	27447364 B/op	  248510 allocs/op
PASS
ok  	github.com/danrusei/dev-state_blog_code/tree/master/diagnose_go_code/iter_4_removejson	13.709s
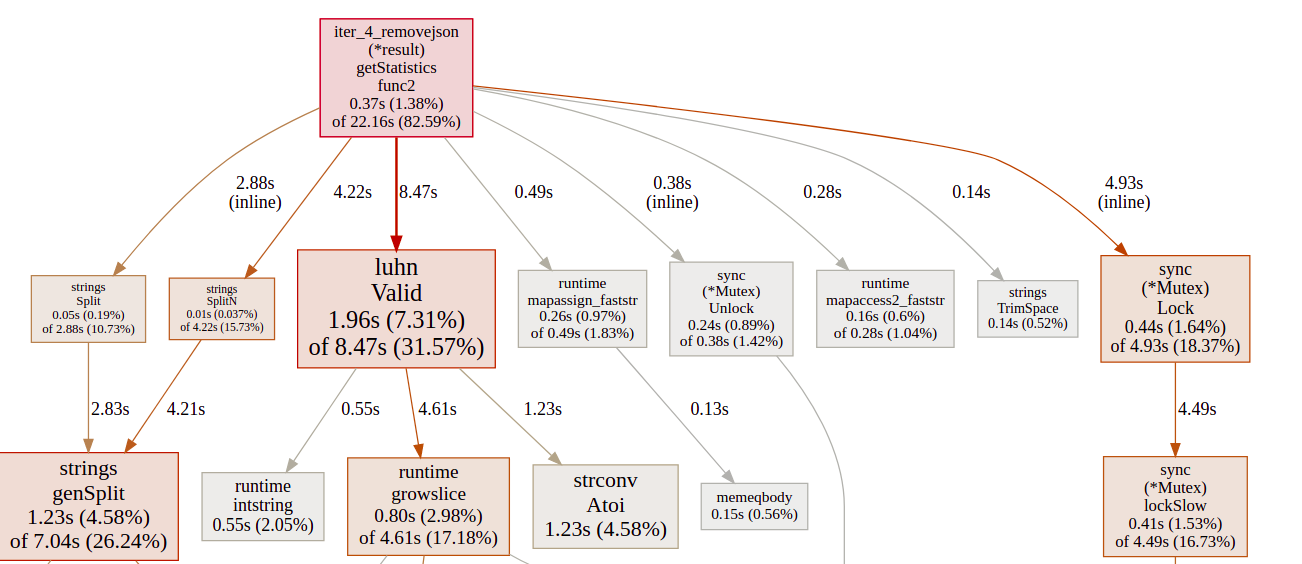
Now the CPU profiler shows us another image, the big consumer is the Luhn algorithm, it takes alot on CPU and Memory. Also we still have alot of contention from the Mutex locks and I guess there are ways to improve it but it is something that I leave to the readers, as my goal was not to create an unbeatable program, instead to show how to use the go tools to diagnose the program.
Iter 5 - Improve Luhn Algorithm
The thing that we haven’t touch until now is the Luhn algorithm, and the measurements indicate that we should investigate it as well.
How the Luhn algorithm works
The Luhn algorithm is a simple checksum formula used to validate a variety of identification numbers, such as credit card numbers and Social Insurance Numbers.
The first step of the Luhn algorithm is to double every second digit, starting from the right. We will be doubling
4539 1488 0343 6467– >4_3_ 1_8_ 0_4_ 6_6_If doubling the number results in a number greater than 9 then subtract 9 from the product. The results of our doubling:
8569 2478 0383 3437Then sum all of the digits:
8+5+6+9+2+4+7+8+0+3+8+3+3+4+3+7 = 80If the sum is evenly divisible by 10, then the number is valid. This number is valid!
The tests I took from the Exercism.io site.
The Luhn script
The script is simple, it ranges over the provided input and takes every rune. It verifies if the rune is a digit. Then convert it from the rune to digit using strconv.Atoi(string(s)) function. If there are no errors, the digit is added to the slice of ints named cleanInput. For anything else than digit or space in the input, the script returns False. It checks the length and iterates one more time over the slice of ints to multiply the second element by 2.
If the resulting sum is divisible by 10 it returns True, otherwise it returns False.
func Valid(input string) bool {
	cleanInput := []int{}
	for _, s := range input {
		if unicode.IsDigit(s) {
			d, err := strconv.Atoi(string(s))
			if err != nil {
				log.Fatal(err)
			}
			cleanInput = append(cleanInput, d)
			continue
		}
		if s != ' ' {
			return false
		}
	}

	if len(cleanInput) < 2 {
		return false
	}

	sum := 0
	isEven := len(cleanInput)%2 == 0
	for _, val := range cleanInput {
		if isEven {
			val *= 2
			if val > 9 {
				val -= 9
			}
		}
		sum += val
		isEven = !isEven
	}

	return sum%10 == 0
}
The intention is to optimize the algorithm itself, threfore the benchmarks should run only against this piece of code. I’m creating a test and a benchmark for this.
func TestValid(t *testing.T) {
	for _, test := range testCases {
		if ok := Valid(test.input); ok != test.ok {
			t.Fatalf("Valid(%s): %s\n\t Expected: %t\n\t Got: %t", test.input, test.description, test.ok, ok)
		}
	}
}

func BenchmarkValid(b *testing.B) {
	for i := 0; i < b.N; i++ {
		Valid("2323 2005 7766 3554")
	}
}
Create the profile, but this time just for the algorithm. We can see 5 allocations.
$ go test -bench Valid -cpuprofile cpu.pprof -benchmem -benchtime 3s
goos: linux
goarch: amd64
pkg: github.com/danrusei/dev-state_blog_code/tree/master/diagnose_go_code/iter_4_removejson/luhn
BenchmarkValid-8   	 8683982	       371 ns/op	     248 B/op	       5 allocs/op
PASS
ok  	github.com/danrusei/dev-state_blog_code/tree/master/diagnose_go_code/iter_4_removejson/luhn	6.362s

########

$ go test -bench Valid -memprofile mem.pprof -benchmem -benchtime 3s
goos: linux
goarch: amd64
pkg: github.com/danrusei/dev-state_blog_code/tree/master/diagnose_go_code/iter_4_removejson/luhn
BenchmarkValid-8   	 8773179	       373 ns/op	     248 B/op	       5 allocs/op
PASS
ok  	github.com/danrusei/dev-state_blog_code/tree/master/diagnose_go_code/iter_4_removejson/luhn	3.694s
Once you have the cpu.pprof and mem.pprof files, run pprof mem.pprof to find the allocations and pprof cpu.pprof to see what eats processor time. The top command shows the list of the largest consumers, in order. The list displays the lines of code, easily spotting the lines that allocate to the Heap. It is obvious, appending to a slice of unknown size will allocate to the Heap.
(pprof) list  github.com/danrusei/dev-state_blog_code/tree/master/diagnose_go_code/iter_4_removejson/luhn.Valid
Total: 2.26GB
ROUTINE ======================== github.com/danrusei/dev-state_blog_code/tree/master/diagnose_go_code/iter_4_removejson/luhn.Valid in /home/rdan/projects_public/dev-state_blog_code/diagnose_go_code/iter_4_removejson/luhn/luhn.go
    2.26GB     2.26GB (flat, cum)   100% of Total
         .          .     13:		if unicode.IsDigit(s) {
         .          .     14:			d, err := strconv.Atoi(string(s))
         .          .     15:			if err != nil {
         .          .     16:				log.Fatal(err)
         .          .     17:			}
    2.26GB     2.26GB     18:			cleanInput = append(cleanInput, d)
         .          .     19:			continue
         .          .     20:		}
         .          .     21:		if s != ' ' {
         .          .     22:			return false
         .          .     23:		}
(pprof)
How to interpret the below profile:
- If you see lots of time spent in
runtime.mallocgcfunction, the program potentially makes excessive amount of small memory allocations. - If you see lots of time spent in
runtime.growslicefunction, the program don’t know the len of the slice from the begining, therefore it has to grow it frequently - If lots of time is spent in channel operations, sync.Mutex code and other synchronization primitives or System component, the program probably suffers from contention.
- If lots of time is spent in syscall.Read/Write, the program potentially makes excessive amount of small reads and writes.
- If lots of time is spent in GC component, the program either allocates too many transient objects or heap size is very small so garbage collections happen too frequently.
In our case "cleanInput = append(cleanInput, d)" and "strconv.Atoi" is causing the most of the load.
(pprof) top
Showing nodes accounting for 5380ms, 75.88% of 7090ms total
Dropped 90 nodes (cum <= 35.45ms)
Showing top 10 nodes out of 77
      flat  flat%   sum%        cum   cum%
    1400ms 19.75% 19.75%     5990ms 84.49%  github.com/danrusei/dev-state_blog_code/tree/master/diagnose_go_code/iter_4_removejson/luhn.Valid
     980ms 13.82% 33.57%      980ms 13.82%  strconv.Atoi
     680ms  9.59% 43.16%     2130ms 30.04%  runtime.mallocgc
     500ms  7.05% 50.21%     3100ms 43.72%  runtime.growslice
     480ms  6.77% 56.98%      480ms  6.77%  runtime.intstring
     430ms  6.06% 63.05%      430ms  6.06%  runtime.memclrNoHeapPointers
     410ms  5.78% 68.83%      410ms  5.78%  runtime.nextFreeFast (inline)
     210ms  2.96% 71.79%      290ms  4.09%  runtime.scanobject
     150ms  2.12% 73.91%      150ms  2.12%  runtime.acquirem (inline)
     140ms  1.97% 75.88%      140ms  1.97%  runtime.memmove
(pprof) top 5
Below is an improved version of the Luhn code, where the Heap is not involved, everything remains on the stack.
The unicode.IsDigit() function was replaced by if s < '0' || s > '9' , and the strconv.Atoi was replaced by n := int(s - '0'). The sum is calculated on the fly so there is no need to create a slice.
func Valid(input string) bool {
	var idx, sum int

	// need to go backwards to be able to work with 2nd digits from the right
	for i := len(input) - 1; i >= 0; i-- {
		s := rune(input[i])
		// handling spaces inside the loop, instead of strings.Replace is a huge difference
		if s == ' ' {
			continue
		}
		// a bit faster than unicode.IsDigit()
		if s < '0' || s > '9' {
			return false
		}
		// keep track of actual index
		idx++

		// get the integer value
		n := int(s - '0')

		if idx%2 == 0 {
			// instead of n *= 2 use bitwise operation
			n <<= 1
			if n > 9 {
				n -= 9
			}
		}
		sum += n
	}
	// check the length
	if idx <= 1 {
		return false
	}

	return sum%10 == 0
}
There algorithm looks different right now and this is what the benchmarks are saying as well. No allocations and the cpu time spent per operation has decreased from 373 ns/op to 24.0 ns/op.
$ go test -bench Valid -cpuprofile cpu.pprof -benchmem -benchtime 3s
goos: linux
goarch: amd64
pkg: github.com/danrusei/dev-state_blog_code/tree/master/diagnose_go_code/iter_5_improveLuhn/luhn
BenchmarkValid-8   	148803892	        24.0 ns/op	       0 B/op	       0 allocs/op
PASS
ok  	github.com/danrusei/dev-state_blog_code/tree/master/diagnose_go_code/iter_5_improveLuhn/luhn	6.219s

########

$ go test -bench Valid -cpuprofile cpu.pprof -benchmem -benchtime 3s
goos: linux
goarch: amd64
pkg: github.com/danrusei/dev-state_blog_code/tree/master/diagnose_go_code/iter_5_improveLuhn/luhn
BenchmarkValid-8   	148803892	        24.0 ns/op	       0 B/op	       0 allocs/op
PASS
ok  	github.com/danrusei/dev-state_blog_code/tree/master/diagnose_go_code/iter_5_improveLuhn/luhn	6.219s
The “mem.pprof” shows nothing this time, as there are no allocations.
Having the Luhn algorithm updated, let’s check out once again the main script. We shaved another 100 ms.
$ time ./iter_5_improveLuhn
There are 169257, out of 1708337, valid Luhn numbers.
United States has the biggest # of visitors, with 717217 of hits.
Europe is the continent with most unique countries that accessed the site more than 1000 times. It has 33 unique countries.

real	0m0,703s
user	0m2,030s
sys	    0m0,310s
Performance measurement
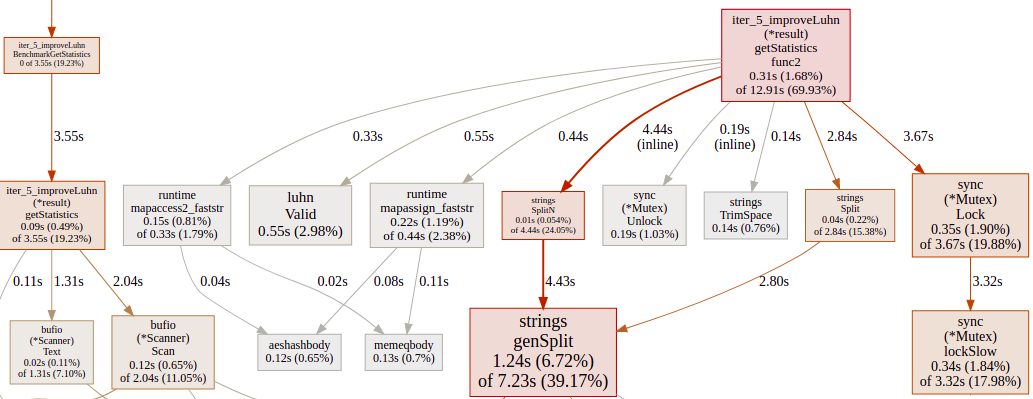
The allocations were cut in half and this is the CPU profile after all the improvements. It’s not bad.
Before conclusion, I’m not pretending that this is the best that you can get. I’m sure that there are ways to make it even faster but that is not the end goal of this article. If you are happy with the code performance there is no reason to spend more cycles on it.
Conclusion
There are many more things to be said about diagnosing Go code. Go offers alot of tools to measure the performance that gives you hints on what can be improved. My intention was to give you just a taste of what the process looks like, it is not always easy to improve performace especially to complex applications, always look first for low hanging fruits and Don’t guess performance, measure it.
Some advices to improve code performance:
- Use Bufio wrappers around os.File or net.Conn if you program makes excessive amount of small reads and writes
- Combine values into larger values. This will reduce number of memory allocations (faster) and also reduce pressure on garbage collector
- Objects that do not contain any pointers (note that strings, slices, maps and chans contain implicit pointers), are not scanned by garbage collector.
- Use
sync.Pooltype that allows to reuse the same object several times in between garbage collections. - Use sync.RWMutex instead of sync.Mutex for read-mostly workloads.
- Consider partitioning and batching of updates to reduce contention.
- Use io.Reader and io.Writer to construct processing pipelines to cap the amount of memory in use per request.
- Use latest release of Go !